Navigating the Visualization
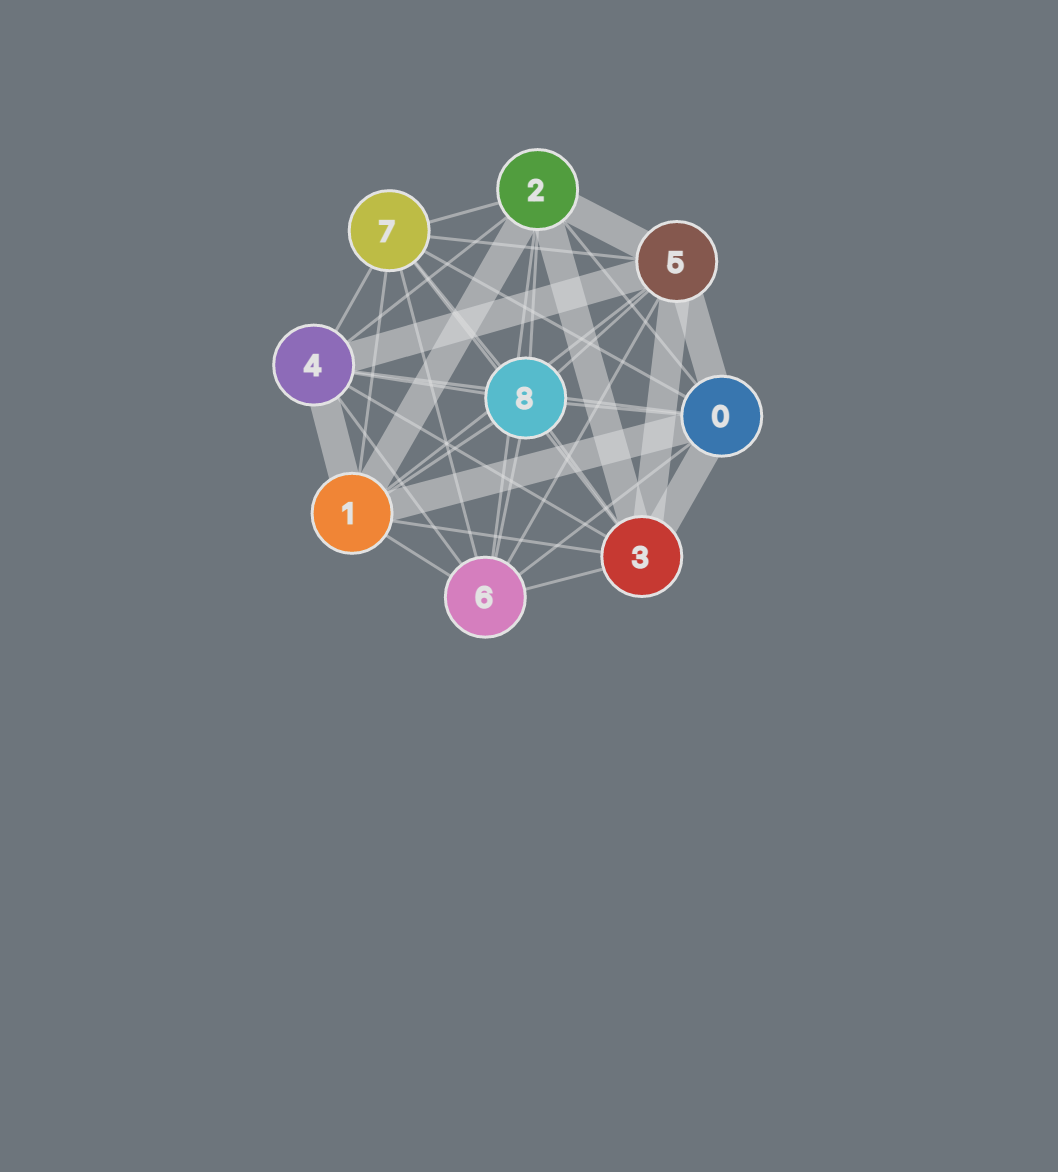
Cluster Graph
This Graph identifies different Clusters and
the extent of
overlap between
them.
Clicking on any Cluster will show a detailed view of the Source and
Targets Procedures within the Cluster
.
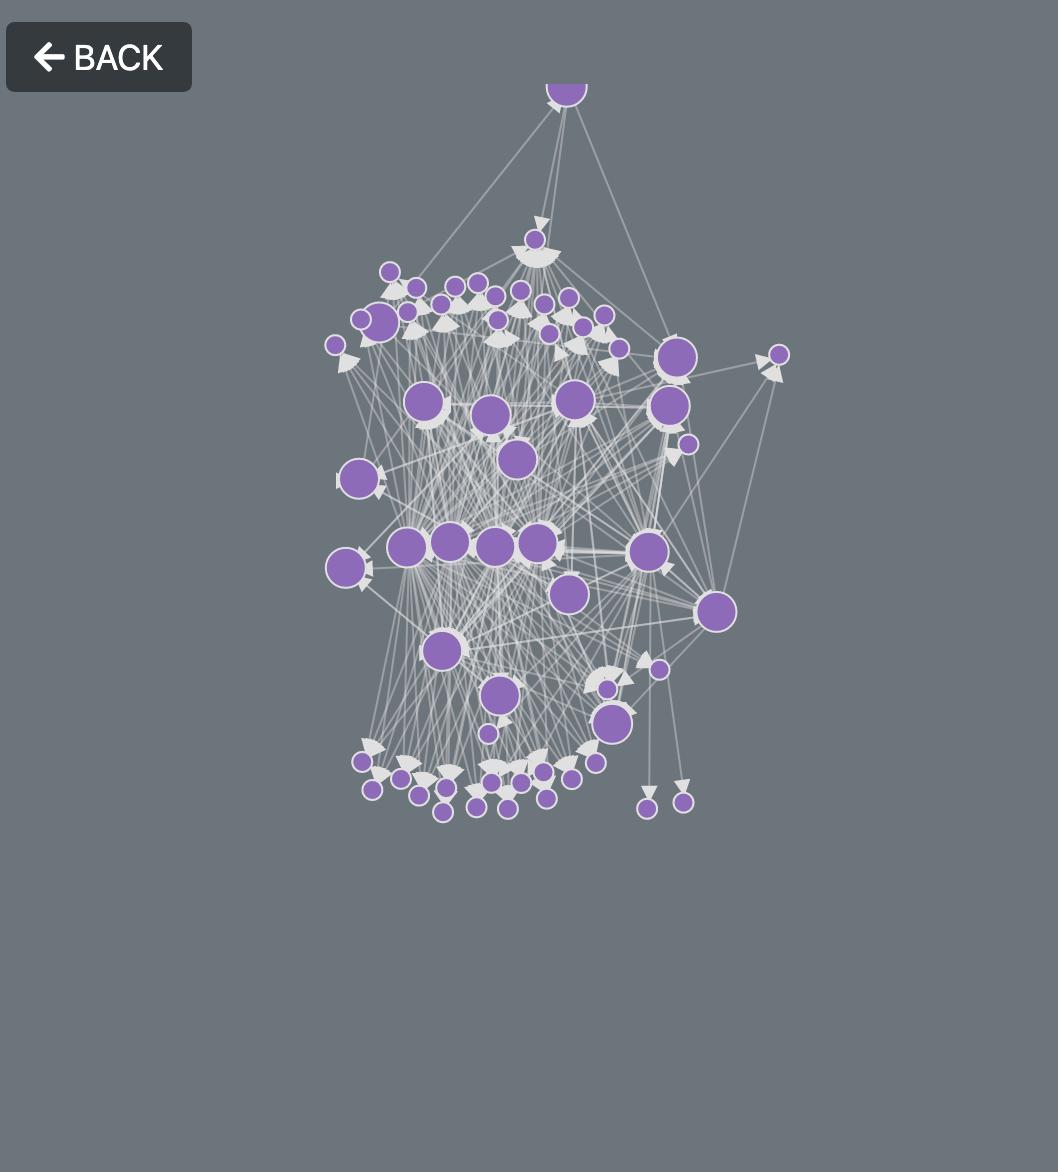
Source-Target Graph
This Graph identifies
Source and Target Procedures within a particular Cluster.
Clicking on a
Source node will pop-up an abstract view of the Source and Targets.
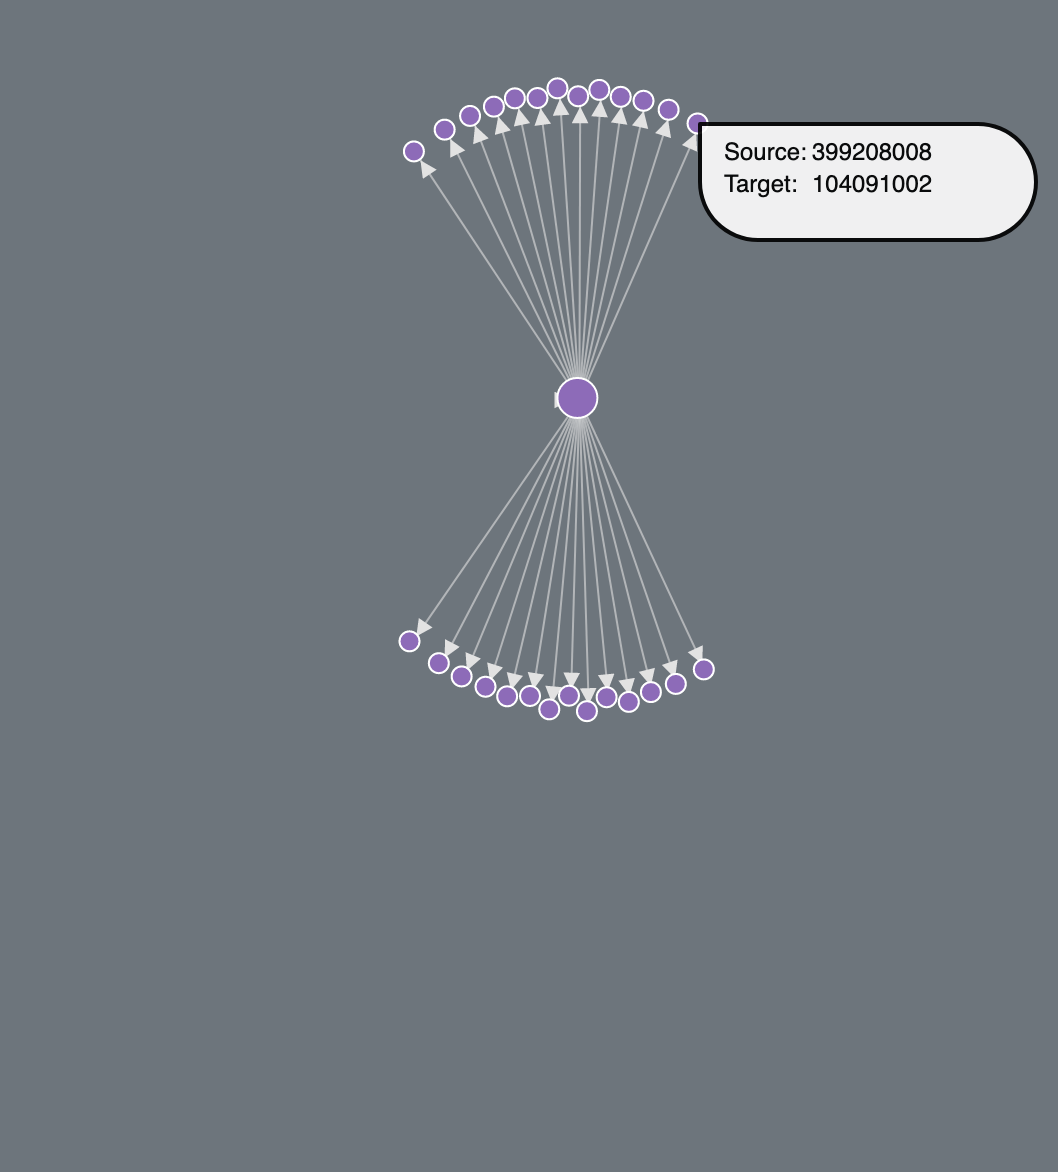
Individual Source Graph
This Graph identifies
Source and Targets for a single Procedure.
At any point hovering over the
nodes will provide a toolip with related information.
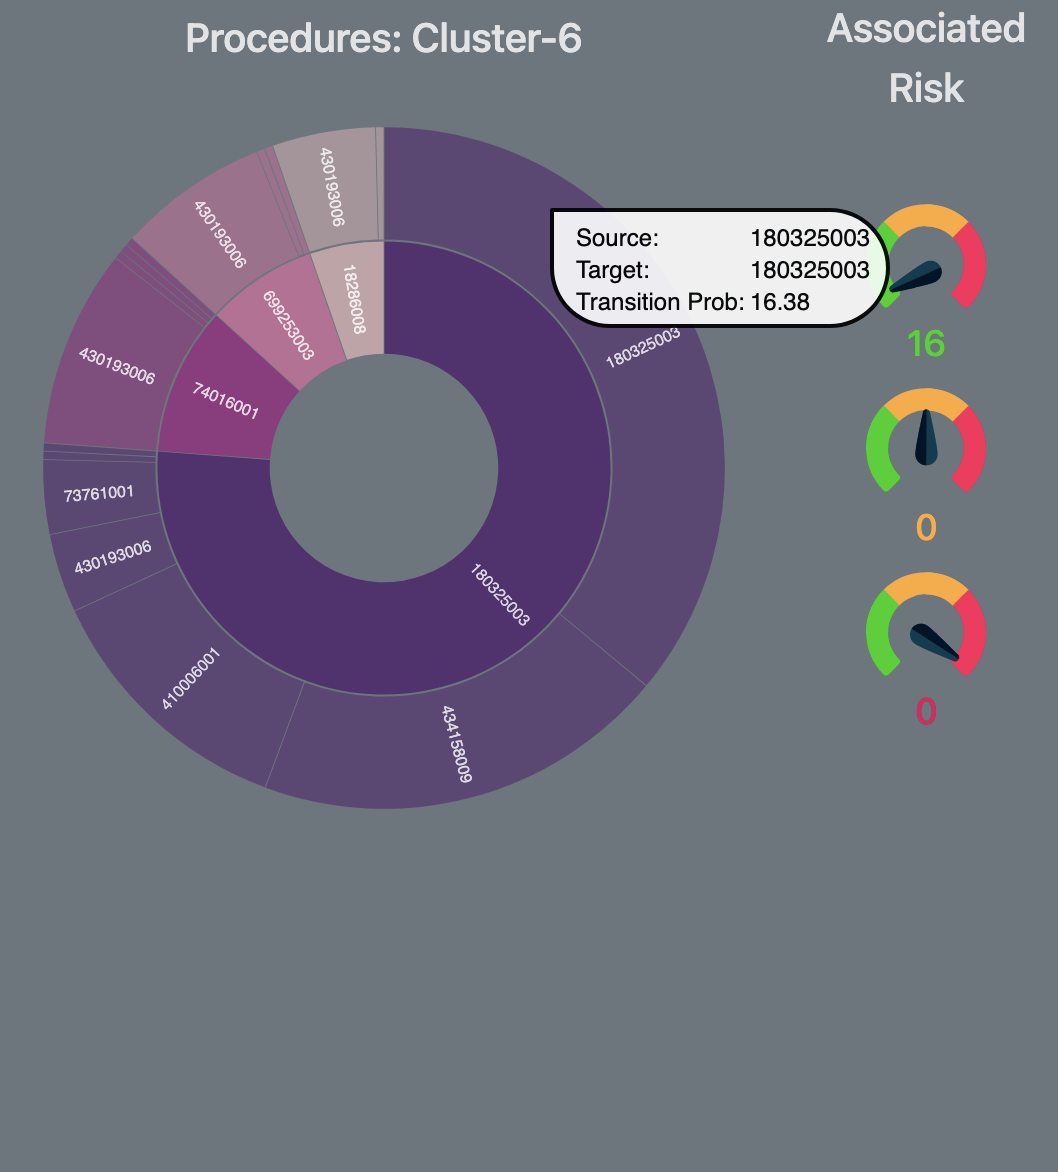
Sunburst View
Selecting a Cluster in the main graph shows up
a Sunburst view of Souce and Targets within the Cluster.
Risk Associated
within each cluster is encoded through glyphs.
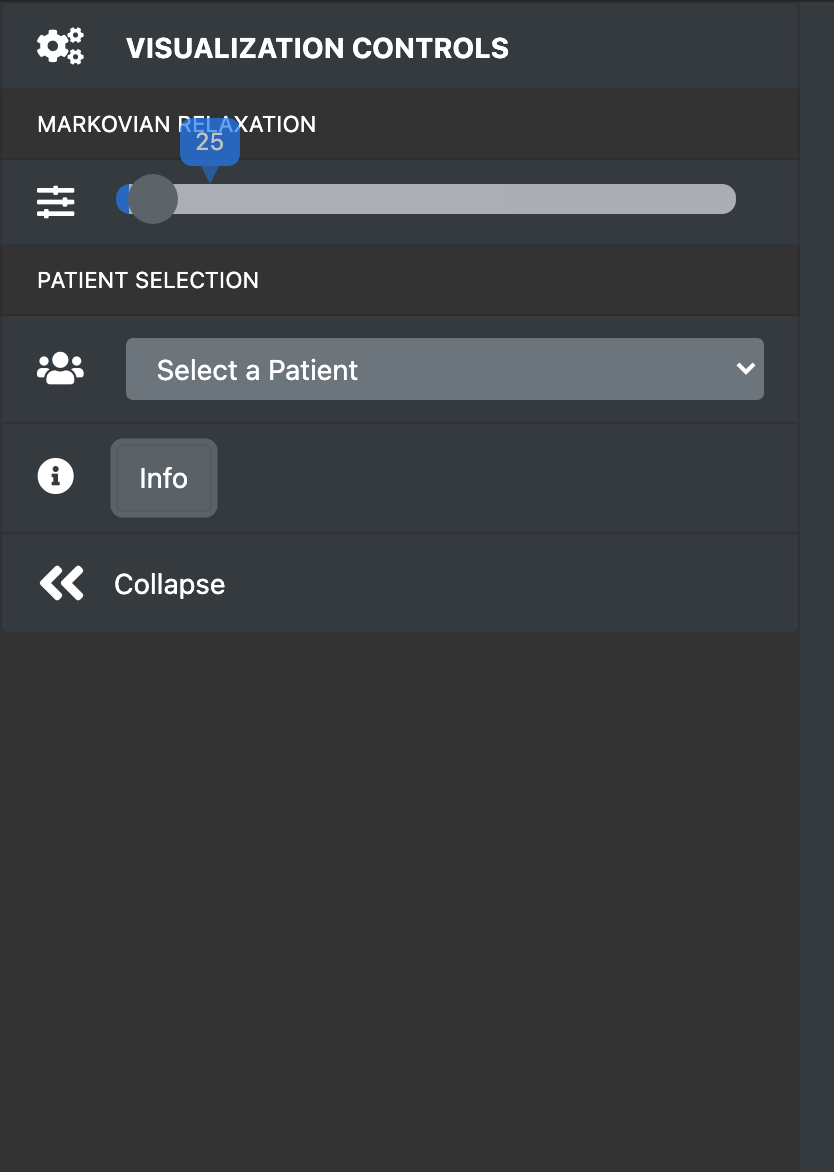
Visualization Controls
The Slider can be used to filter the graph
based on Markovian Relaxation.
Selecting a Patient Id from the Dropdown
menu opens up a hierarchical view of Patient's Epidodes of Care.
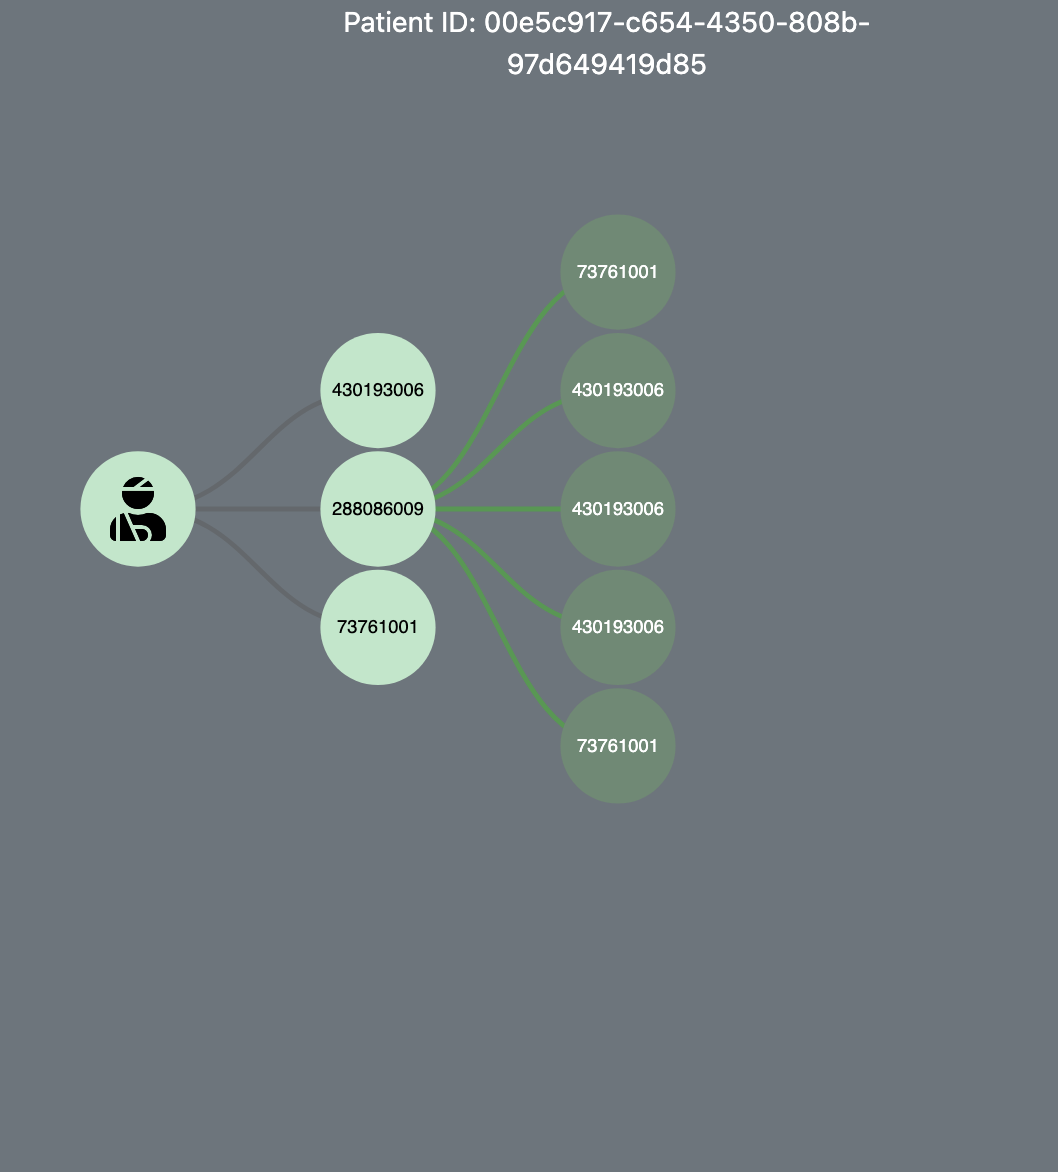
Patient Graph
The Source and Target Procedures for a
particular patient can be viewed here.
The colors on the edges signify the
risk associated with the transition from Source to the Target Procedure.